
Stock Chart Request: C&O


Immediate Resistance: 0.45
Immedate Support: 0.435
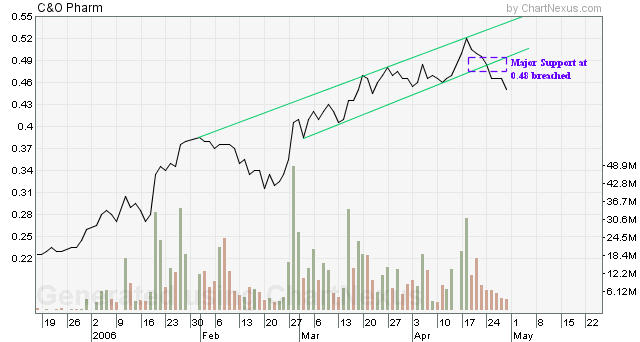
At this point of time, I dun really recommend ppl to take up new positions because I am quite bearish on the market now. However, someone has requested the technical analysis on C&O, so I will try my best to interpret the chart. C&O has lost the major support at 0.48 on 25th April(third chart). Looking at the chart carefully, I notice that C&O has just finished a small Elliot Wave (first chart) which i missed out in the last analysis on 14th April. Wave 1 started from 0.355 to 0.41, Wave 2 ended at 0.385, Wave 3 went up to 0.47, Wave 4 retracted to 0.445 and Wave 5 finished at 0.52. After that, as everyone knows, C&O is facing a correction. In the long term, C&O is still on the uptrend(second chart). For my analysis on 14th April to stay valid, C&O must stay above the next major support shown in the second chart above. If this support is lost, run for your dear life!
posted by Bryan Chin @ 10:57:00 PM
0 comments
![]()


0 Comments:
Post a Comment
<< Home